
|
| weblog/wEssays archives | home | |
|
As the Housing Bubble Pops: Where's the Bottom? (April 3, 2006)  As this chart of the NASDAQ from 1990 to the present illustrates, bubbles tend to
deflate to the underlying trendline. If you consider the trendline, it's as if the
bubble never happened. A similar trendline can be drawn on the charts of all great bubbles:
the Dow 1929, the Nikkei 1989, and so on. Since prices always revert back to the
trend, this line makes a reasonably accurate forecasting or predictive tool.
Which brings us to the current real estate bubble. First, let's take a closer look at the classic NASDAQ bubble shown above. The actual hockey-stick rise which characterized the bubble only lasted about 18 months--from the LTCM meltdown and Russian default in September 1998 to March of 2000.  A year later, the market had already reverted to the trend line. If you
remove that 2.5-year period of sharp rise and decline, the only serious violation of the trend
was the post-bubble drop to 1100 in late 2002. As such over-reactions are another standard
feature of bubbles, such a decline fits the historic profile. Other than this, the market has
followed the trendline with remarkable fidelity.
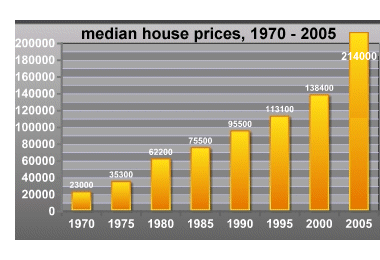
So what's the trendline in the housing market, and where does it suggest prices will finally settle? Note that much of the housing bubble has occurred in an eerily similar period of time--less than two years--from early 2004 to late 2005. This is the period in which housing exploded 40-50% higher in markets such as Phoenix, Florida and Las Vegas, and 30% or more in many California cities. This sudden sharp leap is precisely the pattern of a bubble.  If the housing bubble follows the historic pattern of other bubbles--and there is no
reason to suspect it will deflate any differently than other bubbles--we can forecast a rapid
decline to the underlying trendline. And what is that trendline? If we draw a simple line
from 1970 to the present through the median home price in the U.S. (not adjusted for inflation),
we see that the 25-year period from 1970 to 1995 follows a very regular trendline, despite the
soaring inflation of the early 1980s.
We can see that the appreciation of housing was already above the trendline in 2000, reflecting the general euphoria and asset-appreciation of the go-go late 90s. But the real violation of the trendline has occurred since 2000. The trendline suggests that the median price of a house will fall from $214,000 to about $145,000 in the next few years--a 32% decline. There is other evidence to support this valuation target. If you consult the inflation calculator on the Bureau of Labor Statistics page, you'll find that inflation has risen from 1990 to 2006 by 52%. That is, $1 in 1990 is worth $1.52 in today's currency. (Never mind inflation has been understated for years--that's another story I've covered elsewhere.) That means the median house price of $95,500 in 1990 would equal $145,160 in today's money--remarkably close to the trendline prediction of $145,000. Since inflation has driven the value of $1 in 1970 to over $5, the $23,000 median price house in 1970 would be worth over $120,000 now just from the effects of inflation. It could be argued with legimate references to past bubbles that a post-bubble over-reaction could take the median house price back to this $120,000 level, just as the NASDAQ fell sharply below the trendline in the initial post-bubble deflation. Since the median price of a house in California is $535,000, we can extrapolate a 32% decline to $365,000 as a post-bubble target. This isn't what the real estate industry wants to hear, but the charts are rather persuasive. For more on this subject and a wide array of other topics, please visit my weblog. copyright © 2006 Charles Hugh Smith. All rights reserved in all media. I would be honored if you linked this wEssay to your site, or printed a copy for your own use. |
||
| weblog/wEssays | home |